
Analysis of Gender Differences in HRV of Patients with Myalgic Encephalomyelitis/Chronic Fatigue Syndrome Using Mobile-Health Technology

 ,
,  , , and
Abstract
:1. Introduction
2. Materials and Methods
2.1. Participants
2.2. General Procedure for Data Collection
2.3. Measures
2.3.1. Neurovegetative Complaints Questionnaire (NCQ)
2.3.2. Fatigue Impact Scale
2.3.3. Composite Autonomic Symptom Scale
2.3.4. Pittsburgh Sleep Quality Index
2.3.5. Hospital Anxiety and Depression Scale
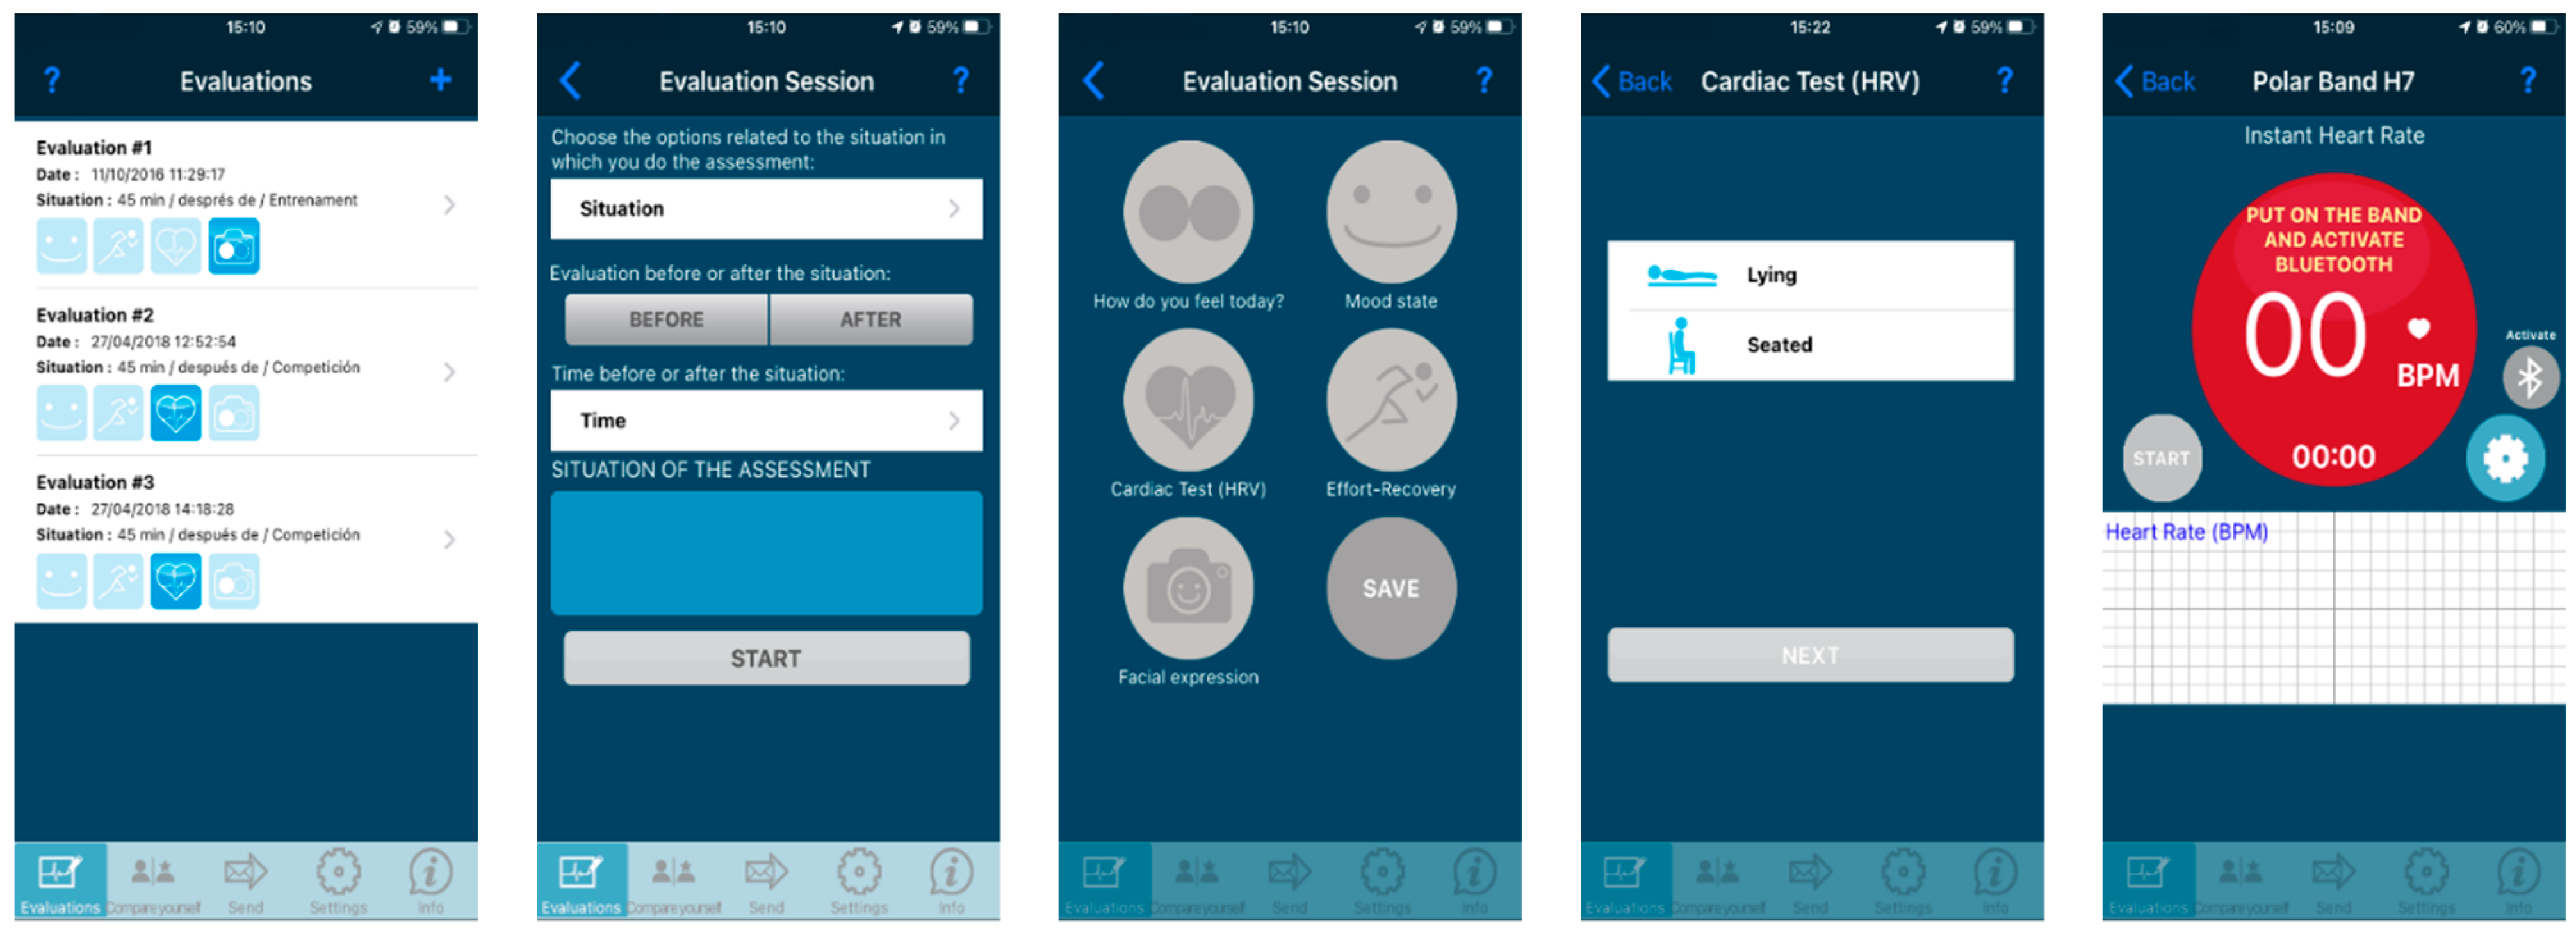
2.3.6. Heart Rate Variability Recording and Analysis
2.4. Data Analysis
3. Results
3.1. Demographic and Clinical Characteristics of Participants (Men)
3.2. Self-Reported Measures (Men)
3.3. Heart Rate Variability Indices (Men)
3.4. Correlation and Regression Analyses (Men)
3.5. Differential Gender Effects and Interactions on Clinical Parameters
3.6. Gender Effects and Interactions on HRV
4. Discussion
4.1. Analysis for Men
4.2. Analysis of Gender Differences
4.3. mHealth Technology for HRV Analysis
5. Conclusions
Author Contributions
Funding
Institutional Review Board Statement
Informed Consent Statement
Conflicts of Interest
References
- Prins, J.B.; van der Meer, J.W.; Bleijenberg, G. Chronic Fatigue Syndrome. Lancet 2006, 367, 346–355. [Google Scholar] [CrossRef]
- Castro-Marrero, J.; Sáez-Francàs, N.; Santillo, D.; Alegre, J. Treatment and Management of Chronic Fatigue syndrome/myalgic Encephalomyelitis: All Roads Lead to Rome. Br. J. Pharmacol. 2017, 174, 345–369. [Google Scholar] [CrossRef] [Green Version]
- Klimas, N.G.; Broderick, G.; Fletcher, M.A. Biomarkers for Chronic Fatigue. Brain Behav. Immun. 2012, 26, 1202–1210. [Google Scholar] [CrossRef] [Green Version]
- Cheema, A.K.; Sarria, L.; Bekheit, M.; Collado, F.; Almenar-Pérez, E.; Martín-Martínez, E.; Alegre, J.; Castro-Marrero, J.; Fletcher, M.A.; Klimas, N.G.; et al. Unravelling Myalgic encephalomyelitis/Chronic Fatigue Syndrome (ME/CFS): Gender-specific Changes in the MicroRNA Expression Profiling in ME/CFS. J. Cell. Mol. Med. 2020, 24, 5865–5877. [Google Scholar] [CrossRef] [Green Version]
- Shaffer, F.; Ginsberg, J.P. An Overview of Heart Rate Variability Metrics and Norms. Front. Public Health 2017, 5, 258. [Google Scholar] [CrossRef] [Green Version]
- Laborde, S.; Mosley, E.; Thayer, J.F. Heart Rate Variability and Cardiac Vagal Tone in Psychophysiological Research—Recommendations for Experiment Planning, Data Analysis, and Data Reporting. Front. Psychol. 2017, 8, 213. [Google Scholar] [CrossRef] [Green Version]
- Hildebrandt, L.K.; McCall, C.; Engen, H.G.; Singer, T. Cognitive Flexibility, Heart Rate Variability, and Resilience Predict Fine-Grained Regulation of Arousal During Prolonged Threat. Psychophysiology 2016, 53, 880–890. [Google Scholar] [CrossRef]
- Mather, M.; Thayer, J.F. How Heart Rate Variability Affects Emotion Regulation Brain Networks. Curr. Opin. Behav. Sci. 2018, 19, 98–104. [Google Scholar] [CrossRef]
- Voss, A.; Schroeder, R.; Heitmann, A.; Peters, A.; Perz, S. Short-Term Heart Rate Variability—Influence of Gender and Age in Healthy Subjects. PLoS ONE 2015, 10, e0118308. [Google Scholar] [CrossRef] [Green Version]
- Li, K.; Rüdiger, H.; Ziemssen, T. Spectral Analysis of Heart Rate Variability: Time Window Matters. Front. Neurol. 2019, 10, 545. [Google Scholar] [CrossRef] [Green Version]
- Nelson, M.J.; Bahl, J.S.; Buckley, J.D.; Thomson, R.L.; Davison, K. Evidence of altered cardiac autonomic regulation in myalgic encephalomyelitis/chronic fatigue syndrome: A systematic review and meta-analysis. Medicine (Baltimore) 2019, 98, e17600. [Google Scholar] [CrossRef]
- Boissoneault, J.; Letzen, J.; Robinson, M.; Staud, R. Cerebral Blood Flow and Heart Rate Variability Predict Fatigue Severity in Patients with Chronic Fatigue Syndrome. Brain Imaging Behav. 2018, 13, 789–797. [Google Scholar] [CrossRef]
- Van Cauwenbergh, D.; Nijs, J.; Kos, D.; Van Weijnen, L.; Struyf, F.; Meeus, M. Malfunctioning of the Autonomic Nervous System in Patients with Chronic Fatigue Syndrome: A Systematic Literature Review. Eur. J. Clin. Investig. 2014, 44, 516–526. [Google Scholar] [CrossRef] [PubMed]
- Escorihuela, R.M.; Capdevila, L.; Castro, J.R.; Zaragozà, M.C.; Maurel, S.; Alegre, J.; Castro-Marrero, J. Reduced Heart Rate Variability Predicts Fatigue Severity in Individuals with Chronic Fatigue syndrome/Myalgic Encephalomyelitis. J. Transl. Med. 2020, 18, 4–12. [Google Scholar] [CrossRef]
- Fiordelli, M.; Diviani, N.; Schulz, P.J. Mapping MHealth Research: A Decade of Evolution. J. Med. Internet Res. 2013, 15, e95. [Google Scholar] [CrossRef] [PubMed]
- Free, C.; Phillips, G.; Felix, L.; Galli, L.; Patel, V.; Edwards, P. The Effectiveness of M-Health Technologies for Improving Health and Health Services: A Systematic Review Protocol. BMC Res. Notes 2010, 3, 250. [Google Scholar] [CrossRef] [PubMed] [Green Version]
- Schondorf, R.; Benoit, J.; Wein, T.; Phaneuf, D. Orthostatic Intolerance in the Chronic Fatigue Syndrome. J. Auton. Nerv. Syst. 1999, 75, 192–201. [Google Scholar] [CrossRef]
- Ruiz, E.; Alegre, J.; Quintana, A.G.; Aliste, L.; Blázquez, A.; De Sevilla, T.F. Síndrome De Fatiga crónica: Estudio De Una Serie Consecutiva De 824 Casos Evaluados En Dos Unidades Especializadas. [Chronic fatigue syndrome: Study of a consecutive series of 824 cases assessed in two specialized units]. Rev. Clínica Española 2011, 211, 385–390. [Google Scholar] [CrossRef]
- Ettinger, S.M.; Silber, D.H.; Collins, B.G.; Gray, K.S.; Sutliff, G.; Whisler, S.K.; McClain, J.M.; Smith, M.B.; Yang, Q.X.; Sinoway, L. Influences of Gender on Sympathetic Nerve Responses to Static Exercise. J. Appl. Physiol. 1996, 80, 245–251. [Google Scholar] [CrossRef]
- Beaston-Wimmer, P.; Smolen, A.J. Gender Differences in Neurotransmitter Expression in the Rat Superior Cervical Ganglion. Dev. Brain Res. 1991, 58, 123–128. [Google Scholar] [CrossRef]
- Huikuri, H.V.; Pikkujämsä, S.M.; Airaksinen, K.J.; Ikäheimo, M.J.; Rantala, A.O.; Kauma, H.; Lilja, M.; Kesäniemi, Y.A. Sex-Related Differences in Autonomic Modulation of Heart Rate in Middle-Aged Subjects. Circulation 1996, 94, 122–125. [Google Scholar] [CrossRef]
- Madden, K.; Savard, G.K. Effects of Mental State on Heart Rate and Blood Pressure Variability in Men and Women. Clin. Physiol. 1995, 15, 557–569. [Google Scholar] [CrossRef]
- Ramaekers, D.; Ector, H.; Aubert, A.; Rubens, A.; Van De Werf, F. Heart Rate Variability and Heart Rate in Healthy Volunteers. Is the Female Autonomic Nervous System Cardioprotective? Eur. Heart J. 1998, 19, 1334–1341. [Google Scholar] [CrossRef]
- Yamasaki, Y.; Kodama, M.; Matsuhisa, M.; Kishimoto, M.; Ozaki, H.; Tani, A.; Ueda, N.; Ishida, Y.; Kamada, T. Diurnal Heart Rate Variability in Healthy Subjects: Effects of Aging and Sex Difference. Am. J. Physiol. Circ. Physiol. 1996, 271, H303–H310. [Google Scholar] [CrossRef]
- Liao, D.; Barnes, R.W.; Chambless, L.E.; Simpson, R.J.; Sorlie, P.; Heiss, G.; The ARIC Investigators. Age, Race, and Sex Differences in Autonomic Cardiac Function Measured by Spectral Analysis of Heart Rate variability—The ARIC Study. Am. J. Cardiol. 1995, 76, 906–912. [Google Scholar] [CrossRef]
- Kuo, T.B.J.; Lin, T.; Yang, C.C.H.; Li, C.-L.; Chen, C.-F.; Chou, P. Effect of Aging on Gender Differences in Neural Control of Heart Rate. Am. J. Physiol. Circ. Physiol. 1999, 277, H2233–H2239. [Google Scholar] [CrossRef]
- Gregoire, J.; Tuck, S.; Hughson, R.L.; Yamamoto, Y. Heart Rate Variability at Rest and Exercise: Influence of Age, Gender, and Physical Training. Can. J. Appl. Physiol. 1996, 21, 455–470. [Google Scholar] [CrossRef]
- Ryan, S.M.; Goldberger, A.L.; Pincus, S.M.; Mietus, J.; Lipsitz, L.A. Gender- and Age-Related Differences in Heart Rate Dynamics: Are Women More Complex Than Men? J. Am. Coll. Cardiol. 1994, 24, 1700–1707. [Google Scholar] [CrossRef] [Green Version]
- David, S.P.; Naudet, F.; Laude, J.; Radua, J.; Fusar-Poli, P.; Chu, I.; Stefanick, M.L.; Ioannidis, J.P.A. Potential Reporting Bias in Neuroimaging Studies of Sex Differences. Sci. Rep. 2018, 8, 6082. [Google Scholar] [CrossRef] [PubMed]
- Maksoud, R.; Du Preez, S.; Eaton-Fitch, N.; Thapaliya, K.; Barnden, L.; Cabanas, H.; Staines, D.; Marshall-Gradisnik, S. A Systematic Review of Neurological Impairments in Myalgic Encephalomyelitis/ Chronic Fatigue Syndrome Using Neuroimaging Techniques. PLoS ONE 2020, 15, e0232475. [Google Scholar] [CrossRef]
- Fukuda, K.; Straus, S.E.; Hickie, I.; Sharpe, M.C.; Dobbins, J.G.; Komaroff, A. The Chronic Fatigue Syndrome: A Comprehensive Approach to Its Definition and Study. International Chronic Fatigue Syndrome Study Group. Ann. Intern. Med. 1994, 121, 953–959. [Google Scholar] [CrossRef]
- Hoogenhout, E.M.; Van Der Elst, W.; De Groot, R.H.M.; Van Boxtel, M.P.; Jolles, J. The Neurovegetative Complaints Questionnaire in the Maastricht Aging Study: Psychometric Properties and Normative Data. Aging Ment. Health 2010, 14, 613–623. [Google Scholar] [CrossRef]
- Fisk, J.D.; Ritvo, P.G.; Ross, L.; Haase, D.A.; Marrie, T.J.; Schlech, W.F. Measuring the Functional Impact of Fatigue: Initial Validation of the Fatigue Impact Scale. Clin. Infect. Dis. 1994, 18, S79–S83. [Google Scholar] [CrossRef]
- Sletten, D.M.; Suarez, G.A.; Low, P.A.; Mandrekar, J.; Singer, W. COMPASS 31: A Refined and Abbreviated Composite Autonomic Symptom Score. Mayo Clin. Proc. 2012, 87, 1196–1201. [Google Scholar] [CrossRef]
- Buysse, D.J.; Reynolds, C.F.; Monk, T.H.; Berman, S.R.; Kupfer, D.J. The Pittsburgh Sleep Quality Index: A New Instrument for Psychiatric Practice and Research. Psychiatry Res. 1989, 28, 193–213. [Google Scholar] [CrossRef]
- Herrero, M.J.; Blanch, J.; Peri, J.M.; De Pablo, J.; Pintor, L.; Bulbena, A. A validation study of the hospital anxiety and depression scale (HADS) in a Spanish population. Gen. Hosp. Psychiatry 2003, 25, 277–283. [Google Scholar] [CrossRef]
- Moreno, J.; Ramos-Castro, J.; Movellan, J.; Parrado, E.; Rodas, G.; Capdevila, L. Facial Video-Based Photoplethysmography to Detect HRV at Rest. Int. J. Sports Med. 2015, 36, 474–480. [Google Scholar] [CrossRef] [PubMed]
- Parrado, E.; Garcia, M.A.; Ramos, J.L.; Cervantes, J.C.; Rodas, G.; Capdevila, L. Comparison of Omega Wave System and Polar S810i to Detect R-R Intervals at Rest. Int. J. Sports Med. 2010, 31, 336–341. [Google Scholar] [CrossRef] [PubMed]
- Malik, M.; Bigger, J.T.; Camm, A.J.; Kleiger, R.E.; Malliani, A.; Moss, A.J.; Schwartz, P.J. Heart Rate Variability: Standards of Measurement, Physiological Interpretation, and Clinical Use: Task Force of the European Society of Cardiology and the North American Society of Pacing and Electrophysiology. Eur. Heart J. 1996, 17, 354–381. [Google Scholar] [CrossRef] [Green Version]
- García-González, M.A.; Fernández-Chimeno, M.; Guede-Fernández, F.; Ferrer-Mileo, V.; Argelagós-Palau, A.; Álvarez-Gómez, L.; Parrado, E.; Moreno, J.; Capdevila, L.; Ramos-Castro, J. A Methodology to Quantify the Differences Between Alternative Methods of Heart Rate Variability Measurement. Physiol. Meas. 2015, 37, 128–144. [Google Scholar] [CrossRef]
- Capdevila, L.; Parrado, E.; Ramos-Castro, J.; Zapata-Lamana, R.; Lalanza, J.F. Resonance Frequency Is Not Always Stable over Time and Could Be Related to the Inter-Beat Interval. Sci. Rep. 2021, 11, 8400. [Google Scholar] [CrossRef]
- Young, H.A.; Benton, D. Heart-Rate Variability: A Biomarker to Study the Influence of Nutrition on Physiological and Psychological Health? Behav. Pharmacol. 2018, 29, 140–151. [Google Scholar] [CrossRef] [Green Version]
- Lehrer, P.M. Heart Rate Variability Biofeedback and Other Psychophysiological Procedures as Important Elements in Psychotherapy. Int. J. Psychophysiol. 2018, 131, 89–95. [Google Scholar] [CrossRef]
- Xhyheri, B.; Manfrini, O.; Mazzolini, M.; Pizzi, C.; Bugiardini, R. Heart Rate Variability Today. Prog. Cardiovasc. Dis. 2012, 55, 321–331. [Google Scholar] [CrossRef]
- Walker, F.R.; Pfingst, K.; Carnevali, L.; Sgoifo, A.; Nalivaiko, E. In the Search for Integrative Biomarker of Resilience to Psychological Stress. Neurosci. Biobehav. Rev. 2017, 74, 310–320. [Google Scholar] [CrossRef]
- Lehrer, P.M.; Gevirtz, R. Heart Rate Variability Biofeedback: How and Why Does It Work? Front. Psychol. 2014, 5, 756. [Google Scholar] [CrossRef] [Green Version]
- Vaschillo, E.G.; Vaschillo, B.; Lehrer, P.M. Characteristics of Resonance in Heart Rate Variability Stimulated by Biofeedback. Appl. Psychophysiol. Biofeedback 2006, 31, 129–142. [Google Scholar] [CrossRef]
- Mccraty, R.; Shaffer, F. Heart Rate Variability: New Perspectives on Physiological Mechanisms, Assessment of Self-Regulatory Capacity, and Health Risk. Glob. Adv. Health Med. 2015, 4, 46–61. [Google Scholar] [CrossRef] [Green Version]
- Ebuchheit, M. Monitoring Training Status with HR Measures: Do All Roads Lead to Rome? Front. Physiol. 2014, 5, 73. [Google Scholar] [CrossRef] [Green Version]
- Holzman, J.B.; Bridgett, D.J. Heart Rate Variability Indices as Bio-Markers of Top-down Self-Regulatory Mechanisms: A Meta-Analytic Review. Neurosci. Biobehav. Rev. 2017, 74, 233–255. [Google Scholar] [CrossRef]
- Oliveira, R.S.; Barker, A.R.; Wilkinson, K.M.; Abbott, R.A.; Williams, C.A. Is Cardiac Autonomic Function Associated with Cardiorespiratory Fitness and Physical Activity in Children and Adolescents? A Systematic Review of Cross-Sectional Studies. Int. J. Cardiol. 2017, 236, 113–122. [Google Scholar] [CrossRef] [Green Version]
- Williams, S.; Booton, T.; Watson, M.; Rowland, D.; Altini, M. Heart Rate Variability Is a Moderating Factor in the Work-Load-Injury Relationship of Competitive CrossFitTM Athletes. J. Sports Sci. Med. 2017, 16, 443–449. [Google Scholar] [PubMed]
- Papaioannou, V.E.; Pneumatikos, I.; Maglaveras, N. Association of Heart Rate Variability and Inflammatory Response in Patients with Cardiovascular Diseases: Current Strengths and Limitations. Front. Physiol. 2013, 4, 174. [Google Scholar] [CrossRef] [Green Version]
- Benichou, T.; Pereira, B.; Mermillod, M.; Tauveron, I.; Pfabigan, D.; Maqdasy, S.; Dutheil, F. Heart Rate Variability in Type 2 Diabetes Mellitus: A Systematic Review and meta–analysis. PLoS ONE 2018, 13, e0195166. [Google Scholar] [CrossRef] [Green Version]
- Elias, M.F.; Torres, R.V. The Renaissance of Heart Rate Variability as a Predictor of Cognitive Functioning. Am. J. Hypertens. 2017, 31, 21–23. [Google Scholar] [CrossRef] [PubMed]
- Alvares, G.A.; Quintana, D.S.; Hickie, I.B.; Guastella, A.J. Autonomic Nervous System Dysfunction in Psychiatric Disorders and the Impact of Psychotropic Medications: A Systematic Review and Meta-Analysis. J. Psychiatry Neurosci. 2016, 41, 89–104. [Google Scholar] [CrossRef] [PubMed] [Green Version]
- Faurholt-Jepsen, M.; Kessing, L.V.; Munkholm, K. Heart Rate Variability in Bipolar Disorder: A Systematic Review and Meta-Analysis. Neurosci. Biobehav. Rev. 2017, 73, 68–80. [Google Scholar] [CrossRef] [PubMed]
- Kidwell, M.; Ellenbroek, B.A. Heart and Soul: Heart Rate Variability and Major Depression. Behav. Pharmacol. 2018, 29, 152–164. [Google Scholar] [CrossRef]
- Kim, H.-G.; Cheon, E.-J.; Bai, D.-S.; Lee, Y.H.; Koo, B.-H. Stress and Heart Rate Variability: A Meta-Analysis and Review of the Literature. Psychiatry Investig. 2018, 15, 235–245. [Google Scholar] [CrossRef] [Green Version]
- Owens, A.P. The Role of Heart Rate Variability in the Future of Remote Digital Biomarkers. Front. Neurosci. 2020, 14. [Google Scholar] [CrossRef]
- Natarajan, A.; Pantelopoulos, A.; Emir-Farinas, H.; Natarajan, P. Heart Rate Variability with Photoplethysmography in 8 Million Individuals: A Cross-Sectional Study. Lancet Digit. Health 2020, 2, e650–e657. [Google Scholar] [CrossRef]
- Economides, M.; Lehrer, P.; Ranta, K.; Nazander, A.; Hilgert, O.; Raevuori, A.; Gevirtz, R.; Khazan, I.; Forman-Hoffman, V.L. Feasibility and Efficacy of the Addition of Heart Rate Variability Biofeedback to a Remote Digital Health Intervention for Depression. Appl. Psychophysiol. Biofeedback 2020, 45, 75–86. [Google Scholar] [CrossRef] [Green Version]
- Fuller, D.; Colwell, E.; Low, J.; Orychock, K.; Tobin, M.A.; Simango, B.; Buote, R.; Van Heerden, D.; Luan, H.; Cullen, K.; et al. Reliability and Validity of Commercially Available Wearable Devices for Measuring Steps, Energy Expenditure, and Heart Rate: Systematic Review. JMIR mHealth uHealth 2020, 8, e18694. [Google Scholar] [CrossRef]
- Singh, N.; Moneghetti, K.J.; Christle, J.W.; Hadley, D.; Plews, D.; Froelicher, V.; Inc, S.C.I. Heart Rate Variability: An Old Metric with New Meaning in the Era of Using MHealth Technologies for Health and Exercise Training Guidance. Part One: Physiology and Methods. Arrhythmia Electrophysiol. Rev. 2018, 7, 193–198. [Google Scholar] [CrossRef] [Green Version]
- Singh, N.; Moneghetti, K.J.; Christle, J.W.; Hadley, D.; Froelicher, V.; Plews, D.; Inc, S.C.I. Heart Rate Variability: An Old Metric with New Meaning in the Era of Using MHealth Technologies for Health and Exercise Training Guidance. Part Two: Prognosis and Training. Arrhythmia Electrophysiol. Rev. 2018, 7. [Google Scholar] [CrossRef] [PubMed]
- Li, K.H.C.; White, F.A.; Tipoe, T.; Liu, T.; Wong, K.C.; Jesuthasan, A.; Baranchuk, A.; Tse, G.; Yan, B.P. The Current State of Mobile Phone Apps for Monitoring Heart Rate, Heart Rate Variability, and Atrial Fibrillation: Narrative Review. JMIR mHealth uHealth 2019, 7, e11606. [Google Scholar] [CrossRef] [PubMed]
- Moraes, J.L.; Rocha, M.X.; Vasconcelos, G.G.; Filho, J.E.V.; De Albuquerque, V.H.C.; Alexandria, A.R. Advances in Photopletysmography Signal Analysis for Biomedical Applications. Sensors 2018, 18, 1894. [Google Scholar] [CrossRef] [PubMed] [Green Version]
- Hernández-Vicente, A.; Hernando, D.; Marín-Puyalto, J.; Vicente-Rodríguez, G.; Garatachea, N.; Pueyo, E.; Bailón, R. Validity of the Polar H7 Heart Rate Sensor for Heart Rate Variability Analysis During Exercise in Different Age, Body Composition and Fitness Level Groups. Sensors 2021, 21, 902. [Google Scholar] [CrossRef] [PubMed]
- Dobbs, W.C.; Fedewa, M.V.; Macdonald, H.V.; Holmes, C.J.; Cicone, Z.S.; Plews, D.J.; Esco, M.R. The Accuracy of Acquiring Heart Rate Variability from Portable Devices: A Systematic Review and Meta-Analysis. Sports Med. 2019, 49, 417–435. [Google Scholar] [CrossRef]


| Variable | Controls (n = 19) | ME/CFS (n = 32) | p-Value |
|---|---|---|---|
| Age (years) | 47.32 ± 1.51 | 47.38 ± 1.52 | N.S. |
| BMI (kg/m2) | 24.69 ± 0.80 | 23.69 ± 0.51 | N.S. |
| SAP (mmHg) | 122.1 ± 2.43 | 131.8 ± 2.54 | 0.014 |
| DAP (mmHg) | 77.91 ± 1.51 | 82.38 ± 1.68 | 0.054 |
| HR (beats/min) | 62.79 ± 1.33 | 70.13 ± 1.85 | 0.007 |
| NCQ (number) | 0.26 ± 0.10 | 7.97 ± 0.46 | <0.001 |
| FIS-40 | |||
| Global score (0–160) | 11.68 ± 4.02 | 135.8 ± 3.91 | <0.001 |
| Physical | 2.47 ± 1.05 | 36.50 ± 0.62 | <0.001 |
| Cognitive | 3.58 ± 1.00 | 34.72 ± 0.72 | <0.001 |
| Psychosocial | 5.63 ± 2.06 | 64.59 ± 2.41 | <0.001 |
| COMPASS-31 | |||
| Global score (0–100) | 20.57 ± 2.93 | 56.83 ± 2.42 | <0.001 |
| Orthostatic intolerance | 3.11 ± 0.41 | 7.56 ± 0.36 | <0.001 |
| Vasomotor | 0 ± 0 | 1.28 ± 0.26 | <0.001 |
| Secretomotor | 0.58 ± 0.21 | 3.94 ± 0.29 | <0.001 |
| Gastrointestinal | 5.84 ± 1.03 | 11.0 ± 0.90 | 0.001 |
| Bladder | 0.58 ± 0.18 | 3.62 ± 0.48 | <0.001 |
| Pupillomotor | 3.16 ± 0.70 | 9.69 ± 0.63 | <0.001 |
| PSQI | |||
| Global score (0–21) | 4.32 ± 0.67 | 14.28 ± 0.77 | <0.001 |
| Subjective sleep quality | 0.53 ± 0.14 | 2.28 ± 0.14 | <0.001 |
| Sleep latency | 0.53 ± 0.18 | 1.84 ± 0.18 | <0.001 |
| Sleep duration | 0.95 ± 0.16 | 1.88 ± 0.19 | 0.001 |
| Habitual sleep efficiency | 0.42 ± 0.23 | 1.72 ± 0.22 | <0.001 |
| Sleep disturbances | 1.00 ± 0.11 | 2.22 ± 0.11 | <0.001 |
| Sleeping medication | 0.32 ± 0.13 | 1.91 ± 0.24 | <0.001 |
| Daytime dysfunction | 0.58 ± 0.14 | 2.44 ± 0.14 | <0.001 |
| HADS | |||
| Global score (0–42) | 7.26 ± 1.0 | 27.38 ± 1.36 | <0.001 |
| Anxiety | 5.21 ± 0.70 | 14.03 ± 0.67 | <0.001 |
| Depression | 2.05 ± 0.49 | 13.34 ± 0.85 | <0.001 |
| Variable | Controls (n = 19) | ME/CFS (n = 32) | p-Value |
|---|---|---|---|
| RR mean (ms) | 901.6 ± 41.0 | 861.3 ± 20.5 | N.S. |
| SDNN (ms) | 41.02 ± 4.52 | 37.38 ± 2.99 | N.S. |
| RMSSD (ms) | 29.37 ± 4.04 | 23.84 ± 2.67 | N.S. |
| pNN50 (%) | 10.79 ± 2.82 | 6.37 ± 1.52 | N.S. |
| LF (ms2) | 897.5 ± 298.8 | 663.6 ± 177.3 | N.S. |
| HF (ms2) | 411.1 ± 115.0 | 287.4 ± 54.8 | N.S. |
| LF/HF | 2.96 ± 0.55 | 2.83 ± 0.35 | N.S. |
| HFnu | 33.11 ± 3.73 | 31.36 ± 2.03 | N.S. |
| Mean RR | SDNN | RMSSD | pNN50 | LF | HF | LF/HF | HFnu | |
|---|---|---|---|---|---|---|---|---|
| PSQI | ||||||||
| Sleep quality | −0.086 | −0.084 | −0.128 | −0.121 | −0.076 | −0.108 | −0.052 | 0.014 |
| Sleep latency | −0.158 | −0.076 | −0.118 | −0.113 | −0.088 | −0.055 | −0.011 | 0.047 |
| Sleep duration | −0.16 | −0.166 | −0.246 | −0.19 | −0.166 | −0.256 | 0.037 | −0.059 |
| Habitual sleep efficiency | −0.119 | −0.123 | −0.146 | −0.06 | −0.152 | −0.035 | −0.066 | 0.115 |
| Sleep disturbances | −0.12 | −0.164 | −0.188 | −0.201 | −0.209 | −0.136 | −0.092 | 0.076 |
| Sleeping medication | −0.234 | −0.072 | −0.125 | −0.092 | −0.166 | −0.051 | 0.009 | 0.04 |
| Daytime dysfunction | −0.062 | −0.081 | −0.126 | −0.176 | −0.142 | −0.095 | −0.091 | 0.059 |
| Global score | −0.175 | −0.136 | −0.193 | −0.167 | −0.181 | −0.127 | −0.046 | 0.056 |
| NCQ | −0.232 | −0.185 | −0.235 | −0.241 | −0.152 | −0.213 | 0.06 | −0.126 |
| FIS-40 | ||||||||
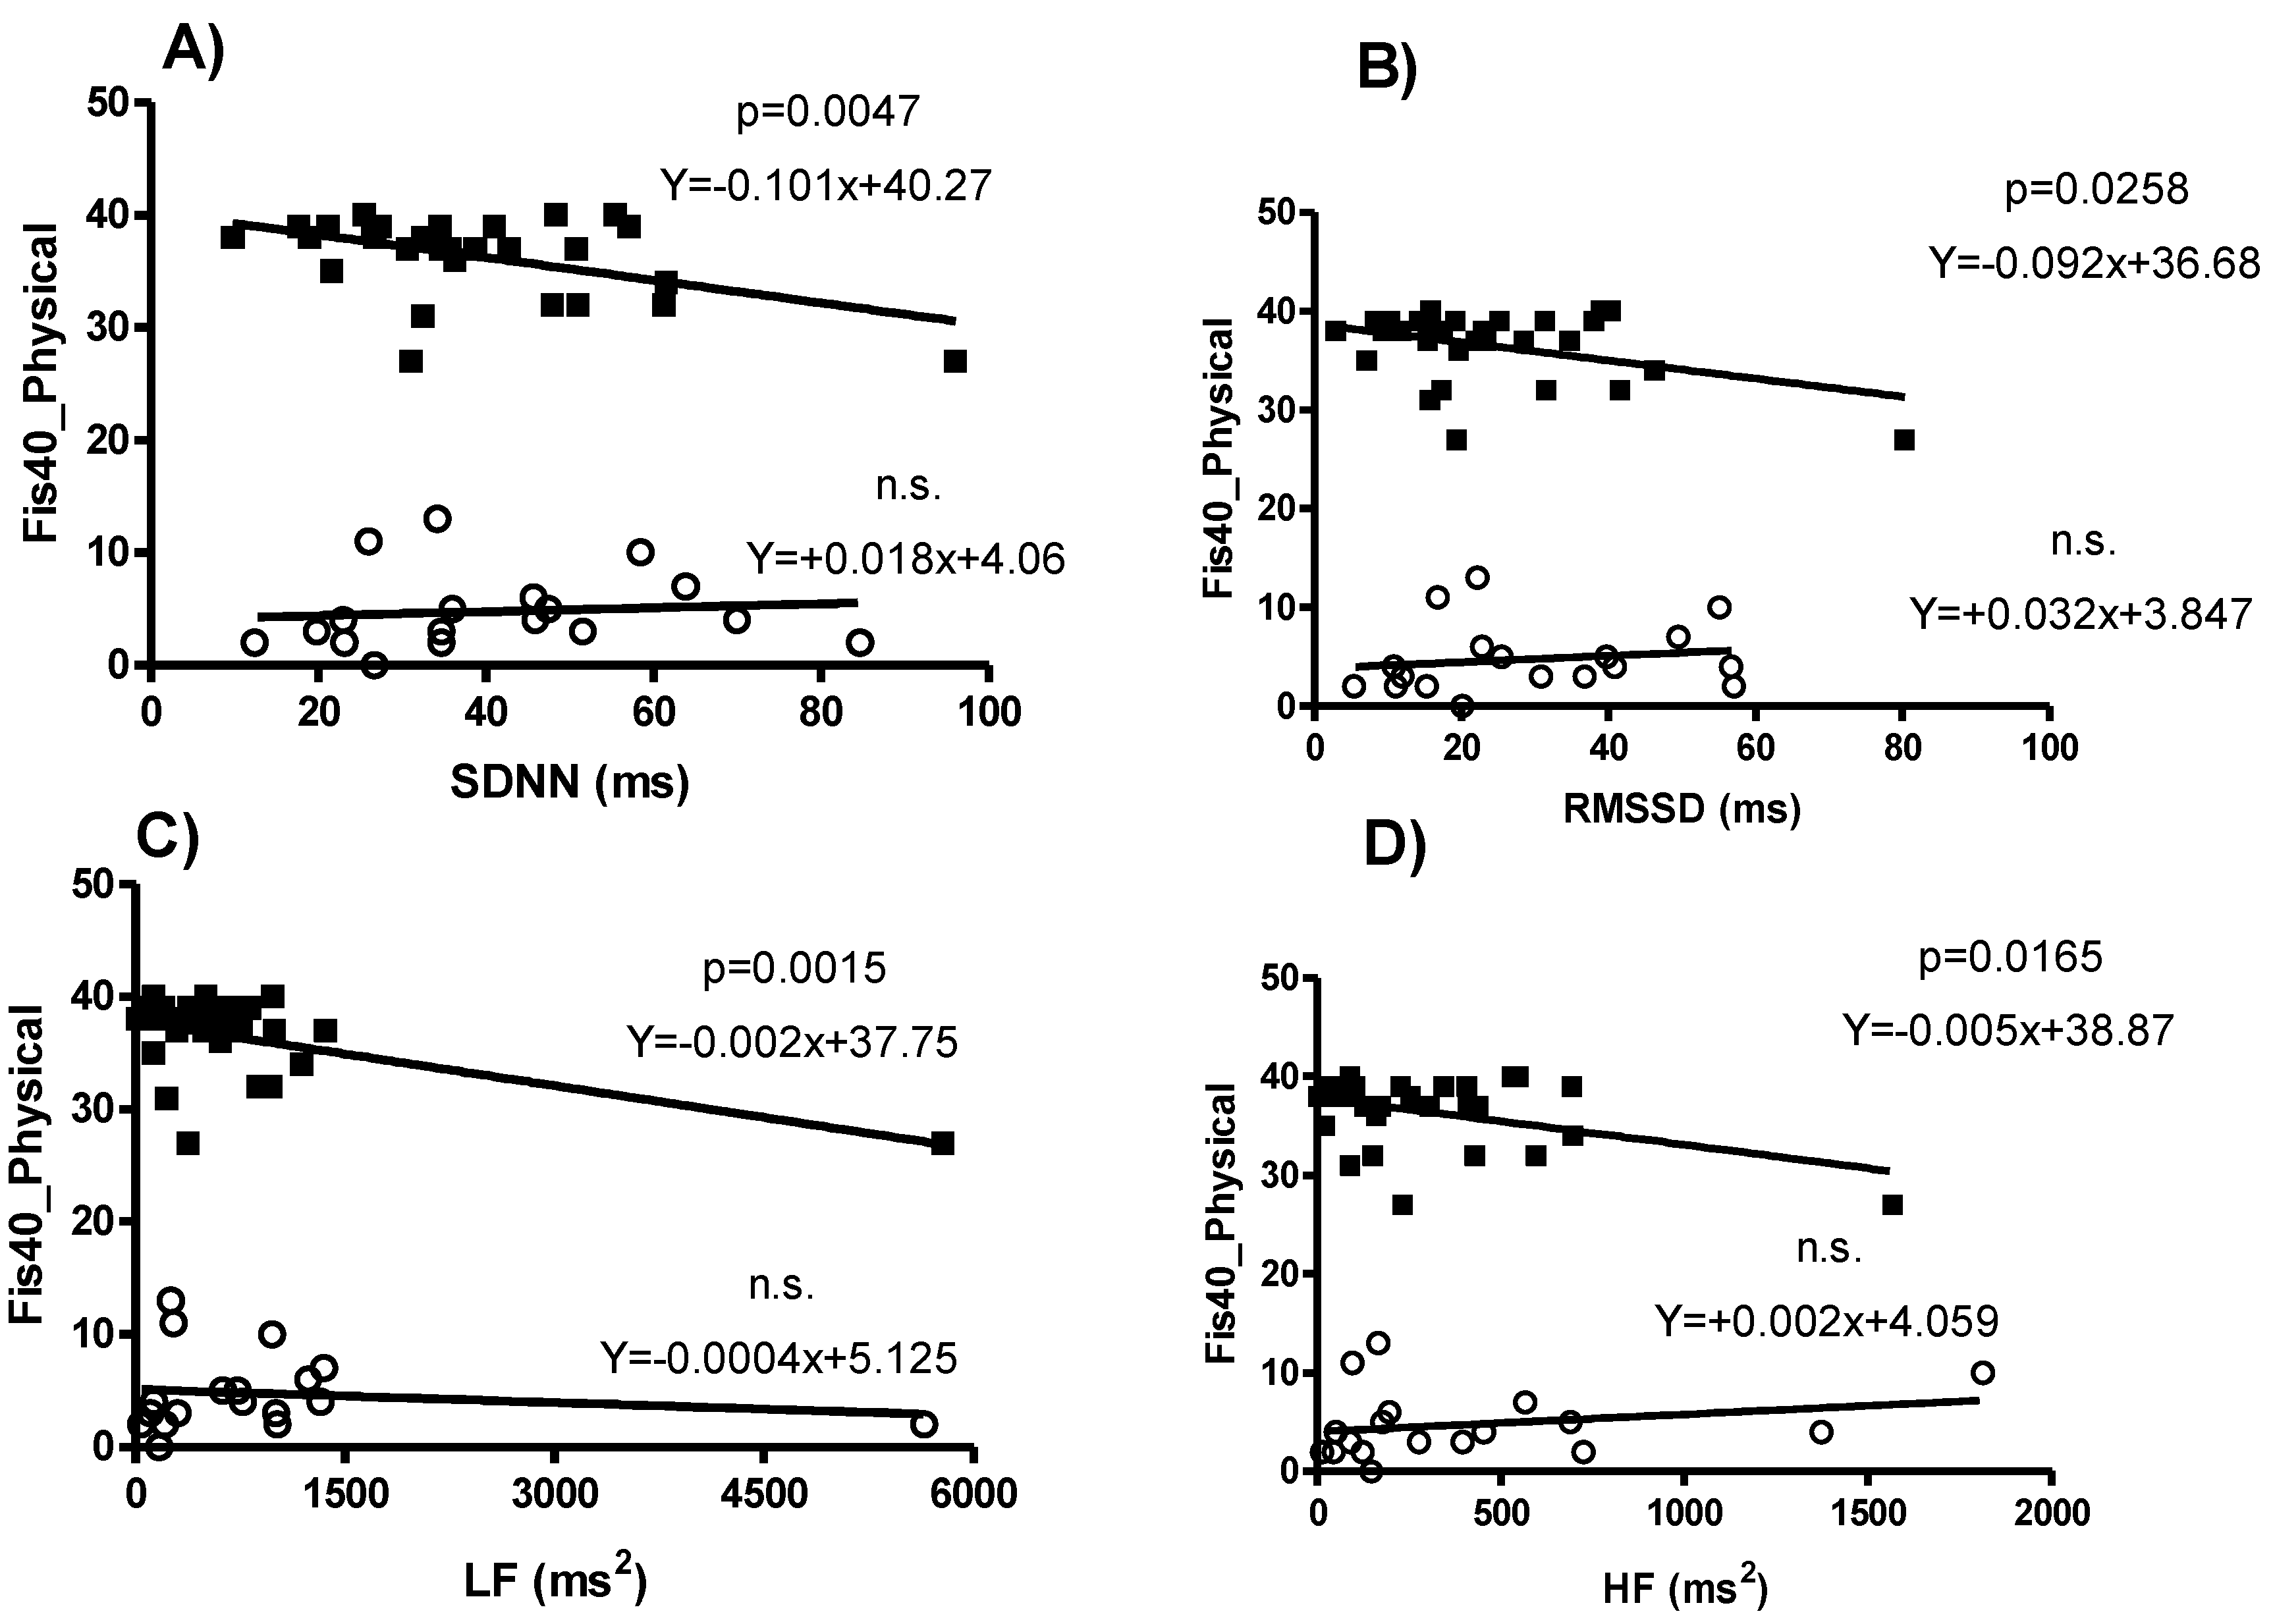
| Physical | −0.173 | −0.184 | −0.239 | −0.279* | −0.167 | −0.223 | −0.055 | −0.018 |
| Cognitive | −0.176 | −0.146 | −0.208 | −0.258 | −0.121 | −0.193 | −0.027 | −0.026 |
| Psychosocial | −0.201 | −0.199 | −0.237 | −0.278 | −0.135 | −0.215 | −0.048 | −0.008 |
| Global score | −0.189 | −0.183 | −0.232 | −0.276 | −0.141 | −0.213 | −0.045 | −0.016 |
| HADS | ||||||||
| Anxiety | −0.123 | −0.101 | −0.085 | −0.086 | −0.07 | −0.064 | −0.139 | 0.107 |
| Depression | −0.228 | −0.236 | −0.231 | −0.224 | −0.134 | −0.214 | −0.003 | −0.026 |
| Global score | −0.189 | −0.183 | −0.173 | −0.17 | −0.11 | −0.153 | −0.066 | 0.035 |
| COMPASS-31 | ||||||||
| Orthostatic intolerance | −0.14 | −0.094 | −0.141 | −0.124 | −0.074 | −0.079 | −0.095 | 0.019 |
| Vasomotor | −0.214 | −0.079 | −0.075 | −0.121 | 0.073 | −0.046 | −0.008 | 0.016 |
| Secretomotor | −0.143 | −0.22 | −0.253 | −0.235 | −0.223 | −0.19 | 0.074 | −0.08 |
| Gastrointestinal | −0.061 | −0.288 * | −0.296 * | −0.291 * | −0.382 ** | −0.221 | −0.193 | 0.195 |
| Bladder | −0.107 | −0.142 | −0.178 | −0.192 | −0.126 | −0.197 | 0.006 | −0.078 |
| Pupillomotor | −0.089 | −0.122 | −0.147 | −0.18 | −0.156 | −0.118 | −0.116 | 0.066 |
| Global score | −0.148 | −0.19 | −0.23 | −0.222 | −0.194 | −0.167 | −0.085 | 0.032 |
| NCQ | FIS-40 | HADS | COMPASS-31 | |
|---|---|---|---|---|
| PSQI | 0.788 ** | 0.819 ** | 0.817 ** | 0.825 ** |
| NCQ | 0.872 ** | 0.770 ** | 0.849 ** | |
| FIS40 | 0.871 ** | 0.817 ** | ||
| HADS | 0.737 ** |
| Male | Female | GENDER Dif. | |||
|---|---|---|---|---|---|
| Variable | Controls (n = 19) | ME/CFS (n = 32) | Controls (n = 25) | ME/CFS (n = 45) | p-Value |
| Age (years) | 47.32 ± 1.51 | 47.38 ± 1.52 | 44.96 ± 1.30 | 46.41 ± 0.84 | N.S. |
| BMI (kg/m2) | 24.69 ± 0.80 | 23.69 ± 0.51 | 23.77 ± 0.61 | 24.59 ± 0.69 | N.S. |
| SAP (mmHg) | 122.1 ± 2.43 | 131.8 ± 2.54 * | 115.2 ± 2.15 | 121.2 ± 1.99 * | <0.001 a |
| DAP (mmHg) | 77.91 ± 1.51 | 82.38 ± 1.68 * | 74.45 ± 1.56 | 79.56 ± 1.38 * | 0.055 a |
| HR (beats/min) | 62.79 ± 1.33 | 70.13 ± 1.85 * | 67.71 ± 1.93 | 74.72 ± 1.21 * | 0.004 a |
| NCQ (num) | 0.26 ± 0.10 | 7.97 ± 0.46 ** | 0.40 ± 0.15 | 10.11 ± 0.28 ** | 0.023 b |
| FIS-40 | |||||
| Global score (0–160) | 11.68 ± 4.02 | 135.8 ± 3.91 ** | 17.12 ± 3.25 | 140.9 ± 1.79 ** | <0.001 |
| Physical | 2.47 ± 1.05 | 36.50 ± 0.62 ** | 4.60 ± 0.94 | 36.95 ± 0.39 ** | <0.001 |
| Cognitive | 3.58 ± 1.00 | 34.72 ± 0.72 ** | 4.48 ± 1.03 | 35.73 ± 0.66 ** | <0.001 |
| Psychosocial | 5.63 ± 2.06 | 64.59 ± 2.41 ** | 8.04 ± 1.46 | 68.27 ± 1.04 ** | <0.001 |
| COMPASS-31 | |||||
| Global score (0–100) | 20.57 ± 2.93 | 56.83 ± 2.42 ** | 27.31 ± 2.42 | 80.10 ± 2.91 ** | <0.001 |
| Orthostatic intolerance | 3.11 ± 0.41 | 7.56 ± 0.36 ** | 2.52 ± 0.25 | 7.45 ± 0.31 ** | <0.001 |
| Vasomotor | 0 ± 0 | 1.28 ± 0.26 ** | 0.48 ± 0.21 | 1.93 ± 0.24 ** | 0.034 a |
| Secretomotor | 0.58 ± 0.21 | 3.94 ± 0.29 ** | 0.76 ± 0.18 | 4.73 ± 0.18 ** | 0.061 a |
| Gastrointestinal | 5.84 ± 1.03 | 11.0 ± 0.90 ** | 5.60 ± 0.74 | 13.45 ± 0.68 ** | 0.001 |
| Bladder | 0.58 ± 0.18 | 3.62 ± 0.48 ** | 0.32 ± 0.11 | 3.48 ± 0.32 ** | <0.001 |
| Pupillomotor | 3.16 ± 0.70 | 9.69 ± 0.63 ** | 2.96 ± 0.46 | 10.32 ± 0.55 ** | <0.001 |
| PSQI | |||||
| Global score (0–21) | 4.32 ± 0.67 | 14.28 ± 0.77 ** | 4.52 ± 0.63 | 15.05 ± 0.57 ** | <0.001 |
| Subjective sleep quality | 0.53 ± 0.14 | 2.28 ± 0.14 ** | 0.56 ± 0.12 | 2.23 ± 0.14 ** | <0.001 |
| Sleep latency | 0.53 ± 0.18 | 1.84 ± 0.18 ** | 0.72 ± 0.17 | 1.89 ± 0.16 ** | <0.001 |
| Sleep duration | 0.95 ± 0.16 | 1.88 ± 0.19 * | 0.92 ± 0.17 | 2.05 ± 0.13 ** | 0.001 |
| Habitual sleep efficiency | 0.42 ± 0.23 | 1.72 ± 0.22 ** | 0.56 ± 0.22 | 1.95 ± 0.17 ** | <0.001 |
| Sleep disturbances | 1.00 ± 0.11 | 2.22 ± 0.11 ** | 1.04 ± 0.07 | 2.27 ± 0.13 ** | <0.001 |
| Sleeping medication | 0.32 ± 0.13 | 1.91 ± 0.24 ** | 0.44 ± 0.12 | 2.55 ± 0.11 ** | <0.001 |
| Daytime dysfunction | 0.58 ± 0.14 | 2.44 ± 0.14 ** | 0.44 ± 0.12 | 2.55 ± 0.11 ** | <0.001 |
| HADS | |||||
| Global score (0–42) | 7.26 ± 1.0 | 27.38 ± 1.36 ** | 5.15 ± 0.70 | 26.68 ± 1.41 ** | <0.001 |
| Anxiety | 5.21 ± 0.70 | 14.03 ± 0.67 ** | 3.96 ± 0.41 | 13.73 ± 0.73 ** | <0.001 |
| Depression | 2.05 ± 0.49 | 13.34 ± 0.85 ** | 1.16 ± 0.29 | 12.95 ± 0.68 ** | <0.001 |
| Male | Female | p-Value (ANOVA) | ||||
|---|---|---|---|---|---|---|
| Variable | M-Controls (n = 19) | M-ME/CFS (n = 32) | W-Controls (n = 25) | W-ME/CFS (n = 45) | Gender | Gender by Group |
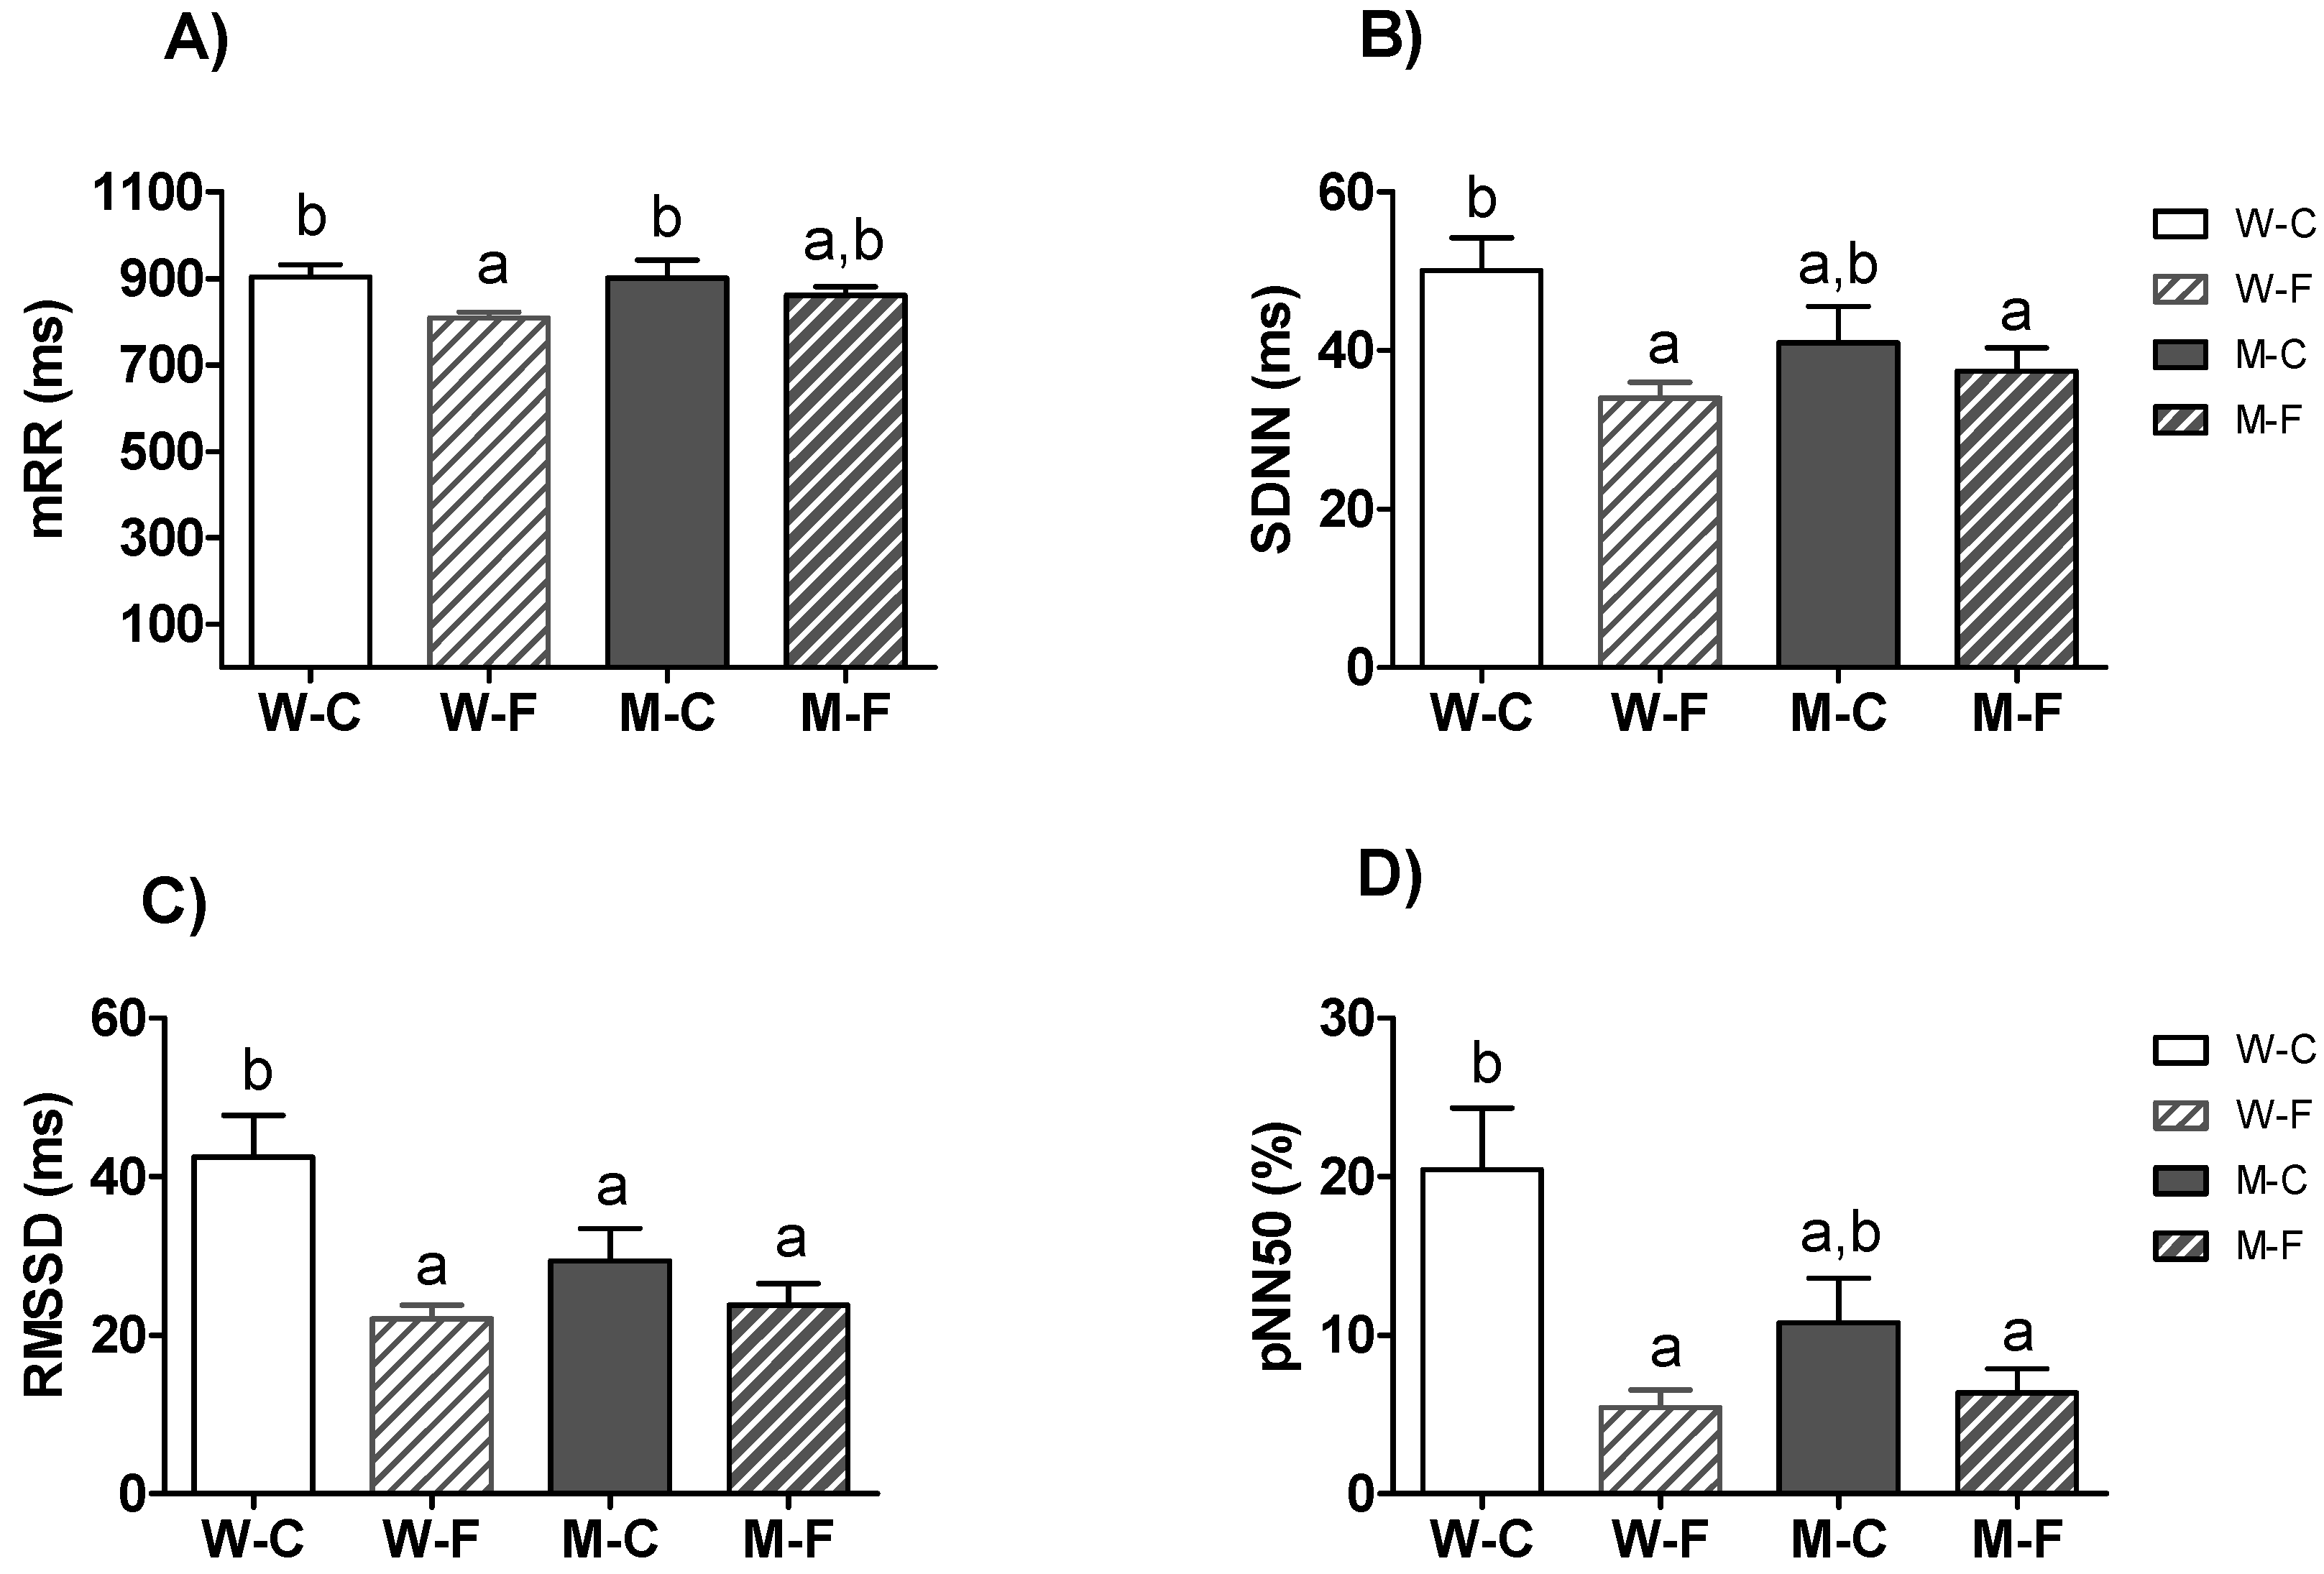
| RRmean (ms) | 901.6 ± 41.0 | 861.3 ± 20.5 | 904.40 ± 27.63 | 809.40 ± 13.54 * | N.S. | N.S. |
| SDNN (ms) | 41.02 ± 4.52 | 37.38 ± 2.99 | 50.06 ± 4.16 | 33.97 ± 2.03 ** | N.S. | N.S. |
| RMSSD (ms) | 29.37 ± 4.04 | 23.84 ± 2.67 | 42.49 ± 5.25 | 22.09 ± 1.72 ** | N.S. | 0.071 |
| pNN50 (%) | 10.79 ± 2.82 | 6.37 ± 1.52 | 20.46 ± 3.89 | 5.44 ± 1.09 ** | N.S. | N.S. |
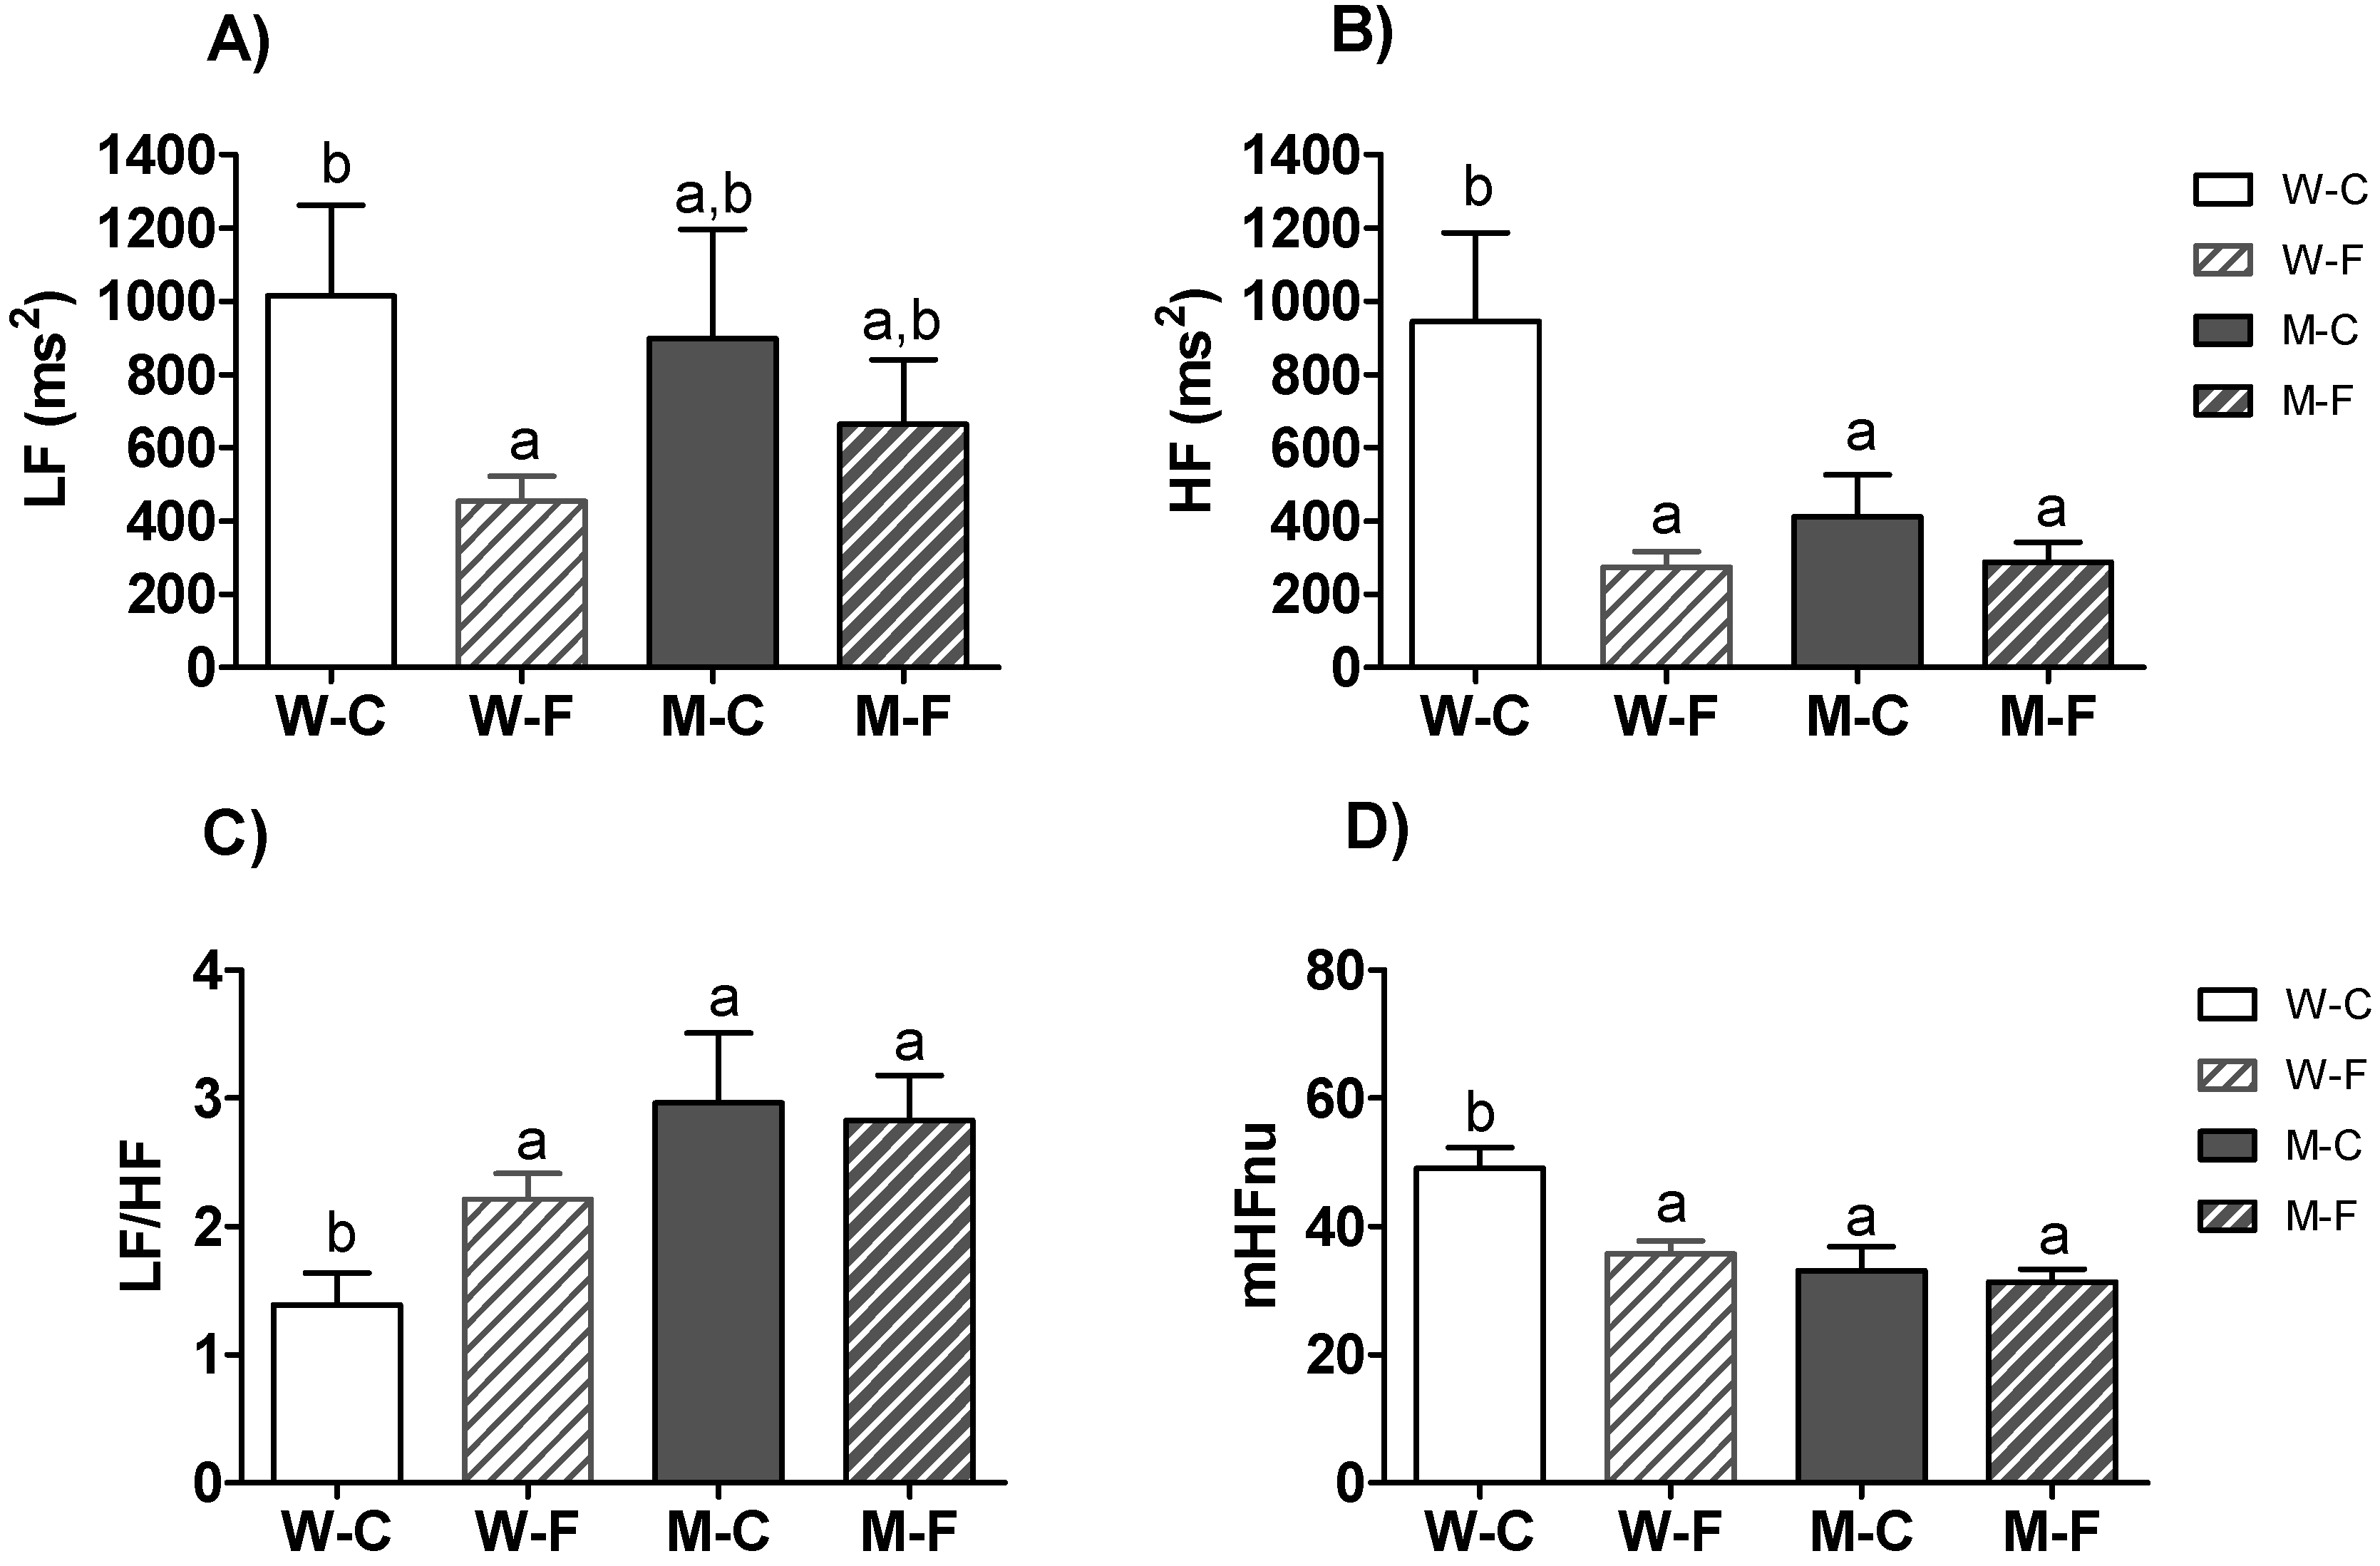
| LF (ms2) | 897.5 ± 298.8 | 663.6 ± 177.3 | 1014.60 ± 247.5 | 453.10 ± 68.40 * | N.S. | N.S. |
| HF (ms2) | 411.1 ± 115.0 | 287.4 ± 54.8 | 944.90 ± 241.8 | 274.73 ± 42.47 ** | 0.037 | 0.036 |
| LF/HF | 2.96 ± 0.55 | 2.83 ± 0.35 | 1.39 ± 0.25 | 2.21 ± 0.20 * | <0.001 | 0.065 |
| HFnu | 33.11 ± 3.73 | 31.36 ± 2.03 | 49.07 ± 3.31 | 35.77 ±1.99 * | N.S. | 0.035 |
Publisher’s Note: MDPI stays neutral with regard to jurisdictional claims in published maps and institutional affiliations. |
© 2021 by the authors. Licensee MDPI, Basel, Switzerland. This article is an open access article distributed under the terms and conditions of the Creative Commons Attribution (CC BY) license (https://creativecommons.org/licenses/by/4.0/).
Share and Cite
Capdevila, L.; Castro-Marrero, J.; Alegre, J.; Ramos-Castro, J.; Escorihuela, R.M. Analysis of Gender Differences in HRV of Patients with Myalgic Encephalomyelitis/Chronic Fatigue Syndrome Using Mobile-Health Technology. Sensors 2021, 21, 3746. https://doi.org/10.3390/s21113746
Capdevila L, Castro-Marrero J, Alegre J, Ramos-Castro J, Escorihuela RM. Analysis of Gender Differences in HRV of Patients with Myalgic Encephalomyelitis/Chronic Fatigue Syndrome Using Mobile-Health Technology. Sensors. 2021; 21(11):3746. https://doi.org/10.3390/s21113746
Chicago/Turabian StyleCapdevila, Lluis, Jesús Castro-Marrero, José Alegre, Juan Ramos-Castro, and Rosa M Escorihuela. 2021. "Analysis of Gender Differences in HRV of Patients with Myalgic Encephalomyelitis/Chronic Fatigue Syndrome Using Mobile-Health Technology" Sensors 21, no. 11: 3746. https://doi.org/10.3390/s21113746